
Hey there,
Network stuff is what’s bringing me here again and very excited of everything I’ve accomplished so far, because it’s been a while since the last time I had to deal with networking things at such low level.
Here is the point:
- You are a network guy with plenty of network devices and a collector able to capture that traffic in a kind of standardized way called NetFlow, which was made up by Cisco back in 1996.
- You want to easily put that information into an analytics box and start getting insights out of it.
- You want to do it before you get retired 🙂
The more I play around with Splunk the more I like it, and this is another reason to think of Splunk as a true Data Platform capable of dealing with any kind of data. It’s just a matter of adding the right App or Add-on and you’ll be ready to go. This time we’ll rely on Splunk Stream which, among other things, is able to capture and ingest NetFlow traffic that you can analyze with Splunk afterwards.
Our demo environment is going to be made of:
- A dockerized Splunk Enterprise instance officially provided by Splunk.
- A Ubuntu Server 16.04 LTS virtual box provided by the OSBoxes guys, where I’ll install the Splunk Independent Stream Forwarder. I’ll face a couple of challenges in here that will be sorted out quickly.
- A dockerized NetFlow traffic generator built by Brent Salisbury.
The following sections will have us “cooking by gas” as it outlines the whole process and the nuances to make all this work.
Step #1 – Splunk Enterprise and Splunk Stream
Spinning up a Splunk Enterprise Docker container is not new to me and I already did it in Agentless sensor data ingestion with Splunk via HEC; I’ll only share the command I have to use to spin it up to keep the post as simple as possible; if you/I need to get/refresh all the details, visit the link above.
docker run -dt --rm -p 8000:8000/tcp -p 8088:8088/tcp \
           --hostname splunk --domainname raulmarin.me \
           --name splunk \
           -e "SPLUNK_PASSWORD=_StrongP4ss" \
           -e "SPLUNK_START_ARGS=--accept-license" \
           splunk/splunk:latest
After a while I’ll have a Splunk Enterprise instance up and running.
I will next install Splunk Stream as follows:
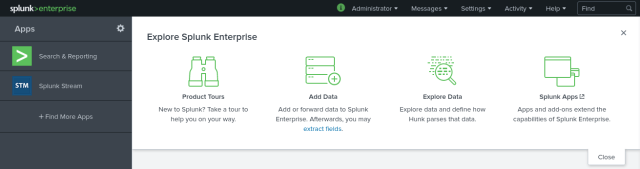
- Open a web browser and go to the http://localhost:8000 URL to access the Splunk Web UI; provide admin credentials (admin:_StrongP4ss) and then search for the Splunk Stream App by clicking the “+ Find More Apps” section at the left hand side:


- Install the App by pressing the green Install button. I’ll be asked for my Splunk credentials which will be used to log me into SplunkBase and then download and install the App. In case of not having a Splunk account yet, visit this link to sign up and get one.
After the App is installed (a restart is needed), your stand-alone dockerized Splunk instance will have the Splunk Stream App and TA (Technical Add-on):
Now it’s time to set it up and, based on all the different deployment architectures available, I’ll go with the Distributed Deployment with an Independent Stream Forwarder. The Install Splunk Stream section is not going to be very handy this time as I’ll go over a different path, but it’s good to keep it under the radar just in case I need it later on.
For the scenario I’m building, I’ll follow the Deploy independent Stream forwarder guide once I have the Ubuntu Server Box up and running which takes me to step #2.
Step #2 – Independent Stream Forwarder on Ubuntu Server
Let’s bring up the Ubuntu Server Box where I’ll deploy the Independent Stream Forwarder; back to the command line, I’ll rely on the axel and 7z tools to download and uncompress, respectively, the Ubuntu Server Box provided by the OSBoxes crew:
$ axel -n 5 https://netix.dl.sourceforge.net/project/osboxes/v/vb/59-U-u-svr/16.04/16.04.6/1604-664.7z
Initializing download: https://netix.dl.sourceforge.net/project/osboxes/v/vb/59-U-u-svr/16.04/16.04.6/1604-664.7z
File size: 356463012 bytes
Opening output file 1604-664.7z
Starting download
...
$ 7z e 1604-664.7z
7-Zip [64] 16.02 : Copyright (c) 1999-2016 Igor Pavlov : 2016-05-21
p7zip Version 16.02 (locale=en_US.utf8,Utf16=on,HugeFiles=on,64 bits,4 CPUs Intel(R) Core(TM) i5-3320M CPU @ 2.60GHz (306A9),ASM,AES-NI)

Scanning the drive for archives:
1 file, 356463012 bytes (340 MiB)

Extracting archive: ../1604-664.7z
...
As a result, I get a file called Ubuntu Server 16.04.6 (64bit).vdi which is the Virtual Disk of the virtual machine where I’ll install the Independent Stream Forwarder. The How to attach/configure image with VirtualBox? guide shows how to make it; I’ll create a 2 x vCPU and 1GB RAM virtual box for this scenario as it should suffice for the ongoing test, could be insufficient for a production deployment though.
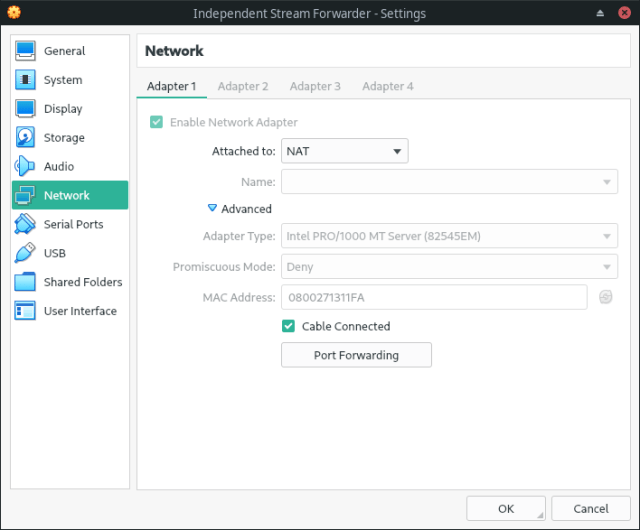
When it comes to network setup, the virtual machine’s network card will be configured for NAT. In order to “let the rest of the world” interact with the virtual machine, we need to redirect TCP and UDP ports as follows:
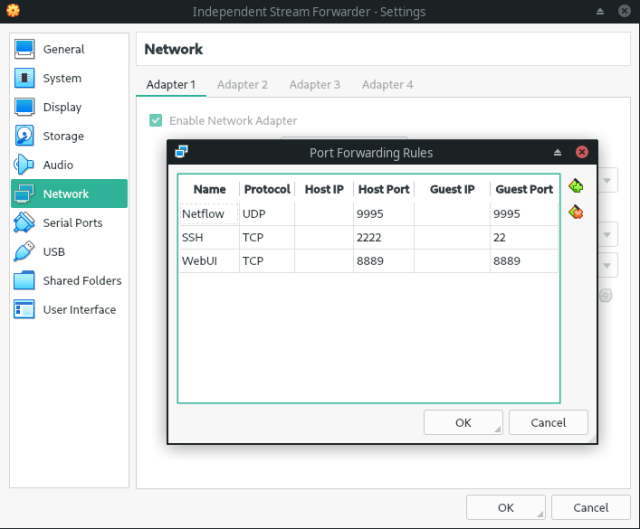
Three port forwarding are needed:
- 9995 UDP port to receive Netflow traffic from the generator.
- 8889 TCP port to check the Independent Stream Forwarder’s web interface.
- 2222 TCP port to reach the virtual machine via SSH (22 TCP port in the virtual machine).
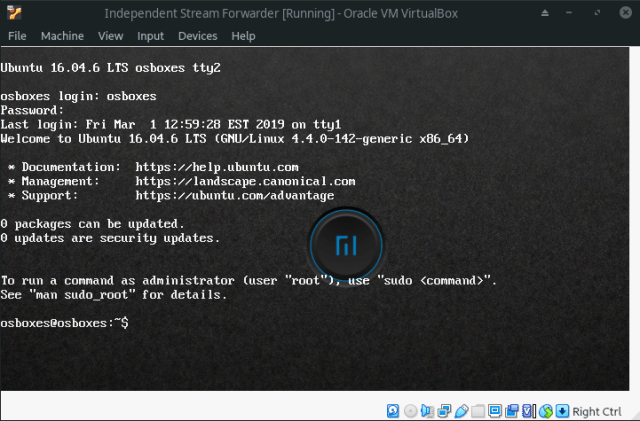
User’s credentials are osboxes:osboxes.org and root’s password is, again, osboxes.org:
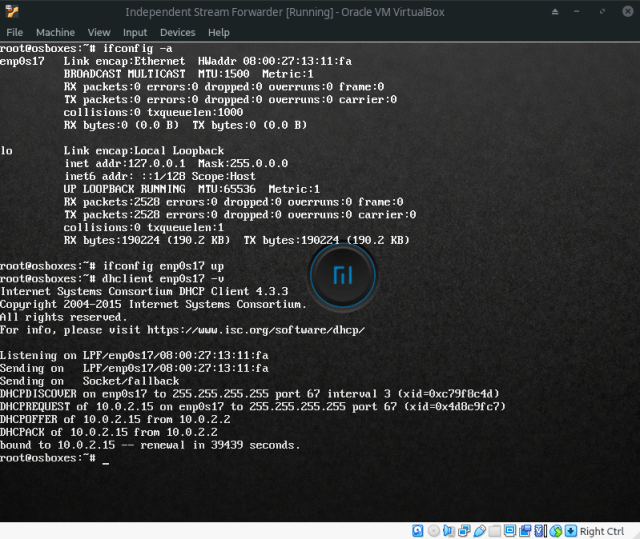
First challenge I’m going to face is making the network connection work. For some reason, the network card is disabled when the virtual machine is started and there is no connectivity to the Internet, therefore I cannot install the Independent Stream Forwarder. Fortunately, I found the way to fix it in Virtualbox Ubuntu 17.04 cannot connect to the internet:

 In order to work in a more comfortable way, I’m going to enable the SSH server by following the How to Enable SSH in Ubuntu 16.04 LTS article:
osboxes@osboxes:~$ sudo su -
root@osboxes:~# apt-get install openssh-server
...
root@osboxes:~# service ssh status
Last but not least, it’s time to install the Independent Stream Forwarder as outlined in Deploy independent Stream forwarder. I’ll use the Install an independent Stream forwarder using curl section to do the installation:
osboxes@osboxes:~$ curl -sSL http://10.0.2.2:8000/en-us/custom/splunk_app_stream/install_streamfwd | sudo bash -s -- --accept-defaults
...
where 10.0.2.2 is the default route for the virtual machine which happens to be the same host where Splunk Enterprise is deployed, and hence that URL is the end point to access Splunk Web UI. More on this later.
Here is where I face the second challenge as the service script shipped to handle the Independent Stream Forwarder daemon doesn’t work with systemd (it’s a sysvinit script). Fortunately, this issue has been addressed in Splunk Answers and I got the solution from 7.1 Streamfwd fails to configure service on ubuntu:
- Even though the init script is failing, it’s very likely that the Independent Stream Forwarder daemon is up and running. Let’s kill it first of all:
osboxes@osboxes:~$ sudo su -
root@osboxes:~# killall -9 streamfwd
- Let’s remove the init script by issuing the following commands:
root@osboxes:~# update-rc.d -f streamfwd remove
root@osboxes:~# rm /etc/init.d/streamfwd
- Let’s create the following systemd service definition file (/etc/systemd/system/streamfwd.service):
[Unit]
Description= Splunk Stream Dedicated Service
After=syslog.target network.target
[Service]
Type=simple
ExecStart=/opt/streamfwd/bin/streamfwd -D
- Finally, we have to enable the new service:
root@osboxes:~# systemctl enable streamfwd
Now I’m able to handle the service properly by using the service command:
Step #3 – Netflow traffic ingestion setup at the Splunk Enterprise side
I have Splunk Enterprise and Splunk Stream up and running at this point. Now I have to set up all in a way that all the parties can communicate with each other.
Let’s start with steps we have to take in the Splunk Enterprise side:
- Most of the setup will be done by the Splunk Stream App; kudos to the team for making this that easy!
The installation process will configure the HEC end point for us, and through the initialization wizard I’ll specify that Netflow traffic will come from an Independent Stream Forwarder:

The warning message “Invalid hostname configured for HTTP Event Collector: $decideOnStartup” is very relevant to make everything work and I’ll show how to get rid of it in a moment. Once this is done, I’ll get to Splunk Stream’s main screen:
- Now I have to tell Splunk Stream that I’m interested in getting Netflow traffic, and this will be picked up by the Independent Stream Forwarder when it’s retrieving part of its configuration from the Splunk Enterprise side.
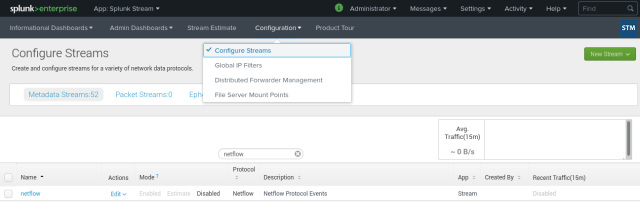
Still in the Splunk Stream App, go to Configure Streams and filter out all the results by typing netflow. By default it’s disabled:
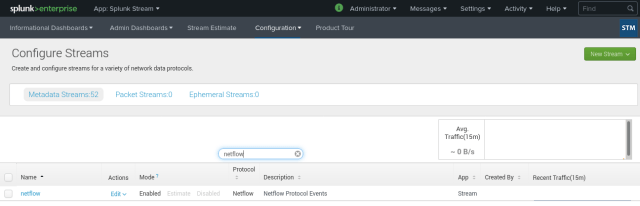
I’ll edit it to enable it, then I’ll save the new setup and it’ll be enabled in the end:

- Next thing to move on with is the removal of the “Invalid hostname configured for HTTP Event Collector: $decideOnStartup” annoying message; best way to confirm I got it in the end is by coming back to the Configure Stream section in Splunk Stream, then go to Distributed Forwarder Management and, finally, press the Install Stream Forwarders button:

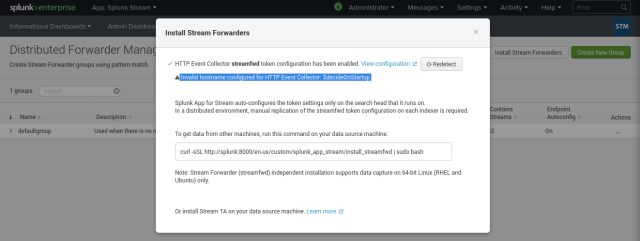
The annoying message is there! I need to use the command line inside the Docker container running the Splunk Enterprise instance:$ docker exec -it splunk /bin/bash
This takes my to a bash interpreter inside SPLUNK_HOME (/opt/splunk) where I’ll change some configuration to fix this thing. Run the following command:
[ansible@splunk splunk]$ cat etc/system/default/inputs.conf | grep decideOnStartup
host = $decideOnStartup
According to inputs.conf’s official documentation, this “sets the field to the hostname of executing machine”. For some reason, and most likely because I’m missing something, this naming resolution is not happening. To fix this, I’ll overwrite the default value in $SPLUNK_HOME/etc/system/local/inputs.conf with the actual hostname (splunk):
[ansible@splunk splunk]$ cat etc/system/local/inputs.conf
[default]
host = splunk

[splunktcp://9997]
disabled = 0
Once this is done, restart Splunk Enterprise by using the Web UI (Settings→System→Server controls):

Go to Distributed Forwarder Management screen one more time, and the annoying message is gone:

- The last thing I need to collect from the Splunk Enterprise side is the HEC token to send Netflow traffic from the Independent Stream Forwarder. In the HTTP Event Collector configuration screen, I have the token I need to setup the Independent Stream Forwarder with:


Step #4 – Netflow traffic ingestion setup at the Independent Stream Forwarder side
Time to setup the Ubuntu Server Box with the Independent Stream Forwarder:
- One more time, naming resolution is going to be key here and we need to pay special attention. I’ll start by adding an /etc/hosts entry to resolve the splunk host name to the virtual machine’s default route (10.0.2.2 in my case):
osboxes@osboxes:~$ cat /etc/hosts | grep splunk
10.0.2.2 splunk
osboxes@osboxes:~$ ping splunk
PING splunk (10.0.2.2) 56(84) bytes of data.
64 bytes from splunk (10.0.2.2): icmp_seq=1 ttl=64 time=0.211 ms
...
- As I did at the Splunk Enterprise side, I’ll add a host entry in the /opt/streamfwd/local/inputs.conf file:
[default]
host = osboxes

[streamfwd://streamfwd]
splunk_stream_app_location = http://10.0.2.2:8000/en-us/custom/splunk_app_stream/
- Last configuration I need here is (1) tell the Independent Stream Forwarder what the HEC token to reach out to our Splunk Enterprise is and (2) setup the Netflow collector.
Section Use manual HEC configuration from Deploy independent Stream forwarder has all the details for #1. Configure Flow collector has all the details for #2. In the end, the /opt/streamfwd/local/streamfwd.conf file should look like this:[streamfwd] ipAddr = 10.0.2.15 httpEventCollectorToken = db755b36-75bd-4696-84c4-c1ff6ee86a84 indexer.0.uri = https://10.0.2.2:8088 netflowReceiver.0.ip = 10.0.2.15 netflowReceiver.0.port = 9995 netflowReceiver.0.decoder = netflow
- This is all for the moment but, before moving on, I’ll double check that all works as expected. In order to do so, start the streamfwd service:
osboxes@osboxes:~$ sudo service streamfwd start
Display the contents of /opt/streamfwd/var/log/streamfwd.log and check if it looks like this:
osboxes@osboxes:~$ cat /opt/streamfwd/var/log/streamfwd.log
2020-04-25 12:22:03 INFO [140564293175104] (CaptureServer.cpp:816) stream.CaptureServer - Found DataDirectory: /opt/streamfwd/data
2020-04-25 12:22:03 INFO [140564293175104] (CaptureServer.cpp:822) stream.CaptureServer - Found UIDirectory: /opt/streamfwd/ui
2020-04-25 12:22:03 INFO [140564293175104] (CaptureServer.cpp:894) stream.CaptureServer - Default configuration directory: /opt/streamfwd/default
2020-04-25 12:22:09 INFO [140564293175104] (CaptureServer.cpp:1847) stream.CaptureServer - Netflow receiver configuration defined; disabling default automatic promiscuous mode packet capture on all available interfaces. Configure one or more streamfwdcapture parameters in streamfwd.conf to enable network packet capture.
2020-04-25 12:22:09 INFO [140564293175104] (SnifferReactor/SnifferReactor.cpp:327) stream.SnifferReactor - No packet processors configured
2020-04-25 12:22:09 INFO [140564293175104] (CaptureServer.cpp:1930) stream.CaptureServer - Starting data capture
2020-04-25 12:22:09 INFO [140564293175104] (SnifferReactor/SnifferReactor.cpp:161) stream.SnifferReactor - Starting network capture: sniffer
2020-04-25 12:22:09 INFO [140564293175104] (main.cpp:1120) stream.main - streamfwd has started successfully (version 7.2.0 build 249)
2020-04-25 12:22:09 INFO [140564293175104] (main.cpp:1122) stream.main - web interface listening on port 8889
Finally, point your browser to http://localhost:8889 and it should display something similar to this:

Step #5 – NetFlow traffic simulation
Our Splunk deployment is ready and I can now plug the Netflow traffic generator to see Splunk Stream dealing with Netflow traffic.
There are many ways of using the Netflow traffic generator I’ve chosen, but the easiest one is that running inside a Docker container. The syntax to make it work is:
docker run -it --rm networkstatic/nflow-generator -t <ip> -p <port>
In my case, the IP address has to be the one setup for my laptop’s network card and port, UDP port actually, has to be 9995 which is mapped to the Ubuntu Server Box (remember details above). IP address can be discovered by using the the ip address command: 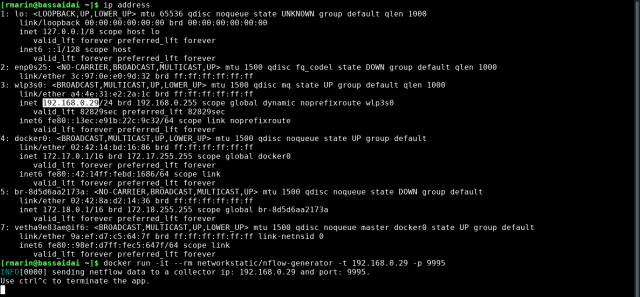
Step #6 – Double checking that is all working
If I follow every single step as detailed, all should work. Before going straight to the Splunk Web UI and run searches, verify the Independent Stream Forwarder’s web interface and check that traffic is going out (Bytes Out increases over time):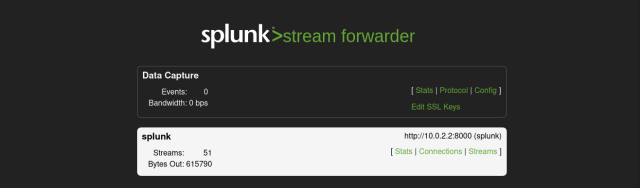
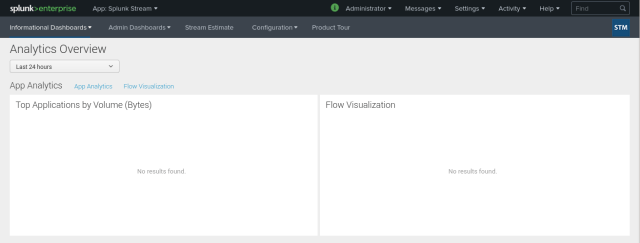
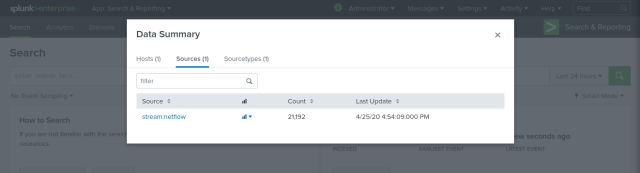
If traffic is going out hurry up, open the “Search & Reporting” App and have a look at what is being indexed in the “main” index (I didn’t change it but any other index can be used):


Congratulations, you did it!
To end this up, the recording of the whole process is the cherry on the cake:
Happy memory refreshing my friend.
Raúl

Pingback: NetFlow traffic ingestion with Splunk Stream and an Independent Stream Forwarder: Part 2 (by Lucas Alados) – Dear future self