
Hi there,
I did it! I was able to get insights from NetFlow traffic with Splunk long before my retirement. Thanks for that Raúl!
Now, imagine you want some help to quickly get value from your Netflow data at Splunk and you want not only to be able to play with real time data but also with long term data (i.e months) and get some trends or even applying advanced analytics on that. You can take advantage of the super flexible Splunk schema on read to exploit your real time data just from the very first moment you get the data into it. Plus you can make use of Splunk’s Data Model Acceleration to get maximum performance for longer term data and enjoy a schema on write experience. You’ll get the best of both worlds! On top of that you will configure it easily in a couple of clicks with the help of Splunk CIM. Thanks to Matthieu Araman for his technical guidance during this journey!
So, let’s start playing with your brand new demo environment explained in NetFlow traffic ingestion with Splunk Stream and an Independent Stream Forwarder.
Step #1 – Deploy Netflow sample dashboards app
First of all, I will download the app for sample dashboards for Netflow from github. This is a sample app I built with a couple of dashboards with several visualizations of the netflow traffic that was ingested to splunk using the netflow traffic generator explained in the first part by Raúl (NetFlow traffic ingestion with Splunk Stream and an Independent Stream Forwarder)

Then I will deploy it in my Splunk Enterprise instance. The steps I will take:
- Open a web browser and go to the http://localhost:8000 URL to access the Splunk Web UI; provide admin credentials (admin:_StrongP4ss), click on the cogwheel icon and then choose “Install app from file”.


- Install the App by clicking on “Choose file” and selecting the .tar file I downloaded from github (netflow_sample_dashboards.tar). Press the green Upload button.

After the App is installed, your stand-alone dockerized Splunk instance will have the Netflow sample dashboards app:

Step #2 – Install required splunkbase apps
To be able to enjoy the schema on write experience and some cool visualizations I will need to install the following apps from Splunkbase:
- Splunk Common Information Model (CIM) app
- Splunk Sankey Diagram – Custom Visualization
- Force Directed App for Splunk
I will follow the next steps to perform the apps installation:
- Open a web browser and go the http://localhost:8000 URL to access the Splunk Web UI; provide admin credentials (admin:_StrongP4ss) and then search for the Splunk Common Information Model (CIM) app by clicking the “+ Find More Apps” section at the left hand side:

- Install the App by pressing the green Install button. I’ll be asked for my Splunk credentials which will be used to log me into SplunkBase and then download and install the App.
- Do the same for Splunk Sankey Diagram – Custom Visualization and Force Directed App for Splunk


After the Apps are installed (a restart maybe needed), your stand-alone dockerized Splunk instance will have the Splunk Common Information Model (CIM) app, Splunk Sankey Diagram – Custom Visualization app and Force Directed App for Splunk


Step #3 – Set up Splunk Stream to send netflow logs to a specific index
For several reasons, including data management purposes and data model acceleration performance it is frequently interesting to split different sources of data into different Splunk indexes. In the first part of this tutorial (NetFlow traffic ingestion with Splunk Stream and an Independent Stream Forwarder) netflow logs were sent directly to default index. sample dashboards for Netflow app comes with a specific index for netflow traffic: netflow_index. Now I will also need to modify Splunk Stream configuration to send the traffic towards this new index. I will perform the following steps:
- Click on Splunk>Enterprise icon in the upper left of the web portal to go the Splunk landing page, click on Settings and then under Data choose Indexes

- Have a look and see that a new index was created when the app was installed: netflow_index. By clicking in Edit you could change its configuration. But for now I will leave it as it comes with the app:

- Go to Splunk Stream app by selecting it from the Apps list in the upper right and click on Configuration, Configure Streams


- Go to the stream I configured previously to receive Netflow and click on Edit, in the index menu select netflow_index, and click on the save green button at the right.


- I will check that now the netflow logs are being indexed at netflow_index. To do that go to Search & Reporting App, and in the Search menu perform a new search: index=netflow_index and see new logs are being indexed:

Step #4 – Set up data model acceleration
Now I will configure the data model acceleration to get the desired schema on write experience for long tail data. To have a look at the fields managed at Network Traffic Data model at Splunk CIM have a look at the Common information model add-on manual. To perform the configuration I will follow the next steps:
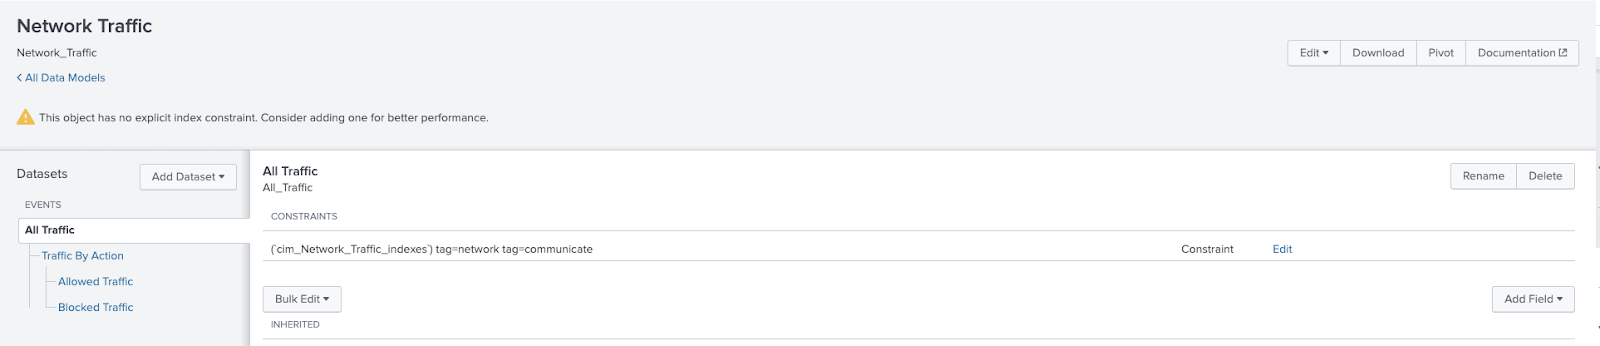
- Click on Datasets and filter by Network traffic and choose Network Traffic > All Traffic click on Manage and select Edit Data Model


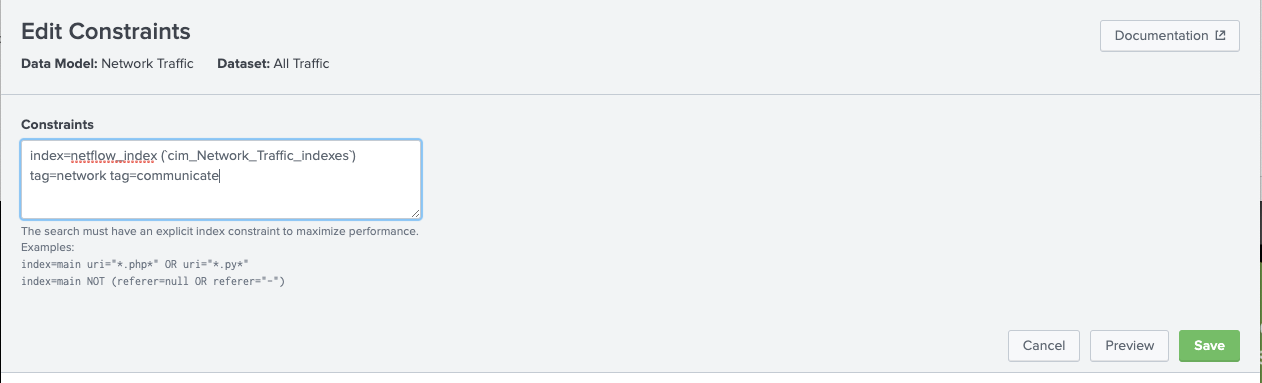
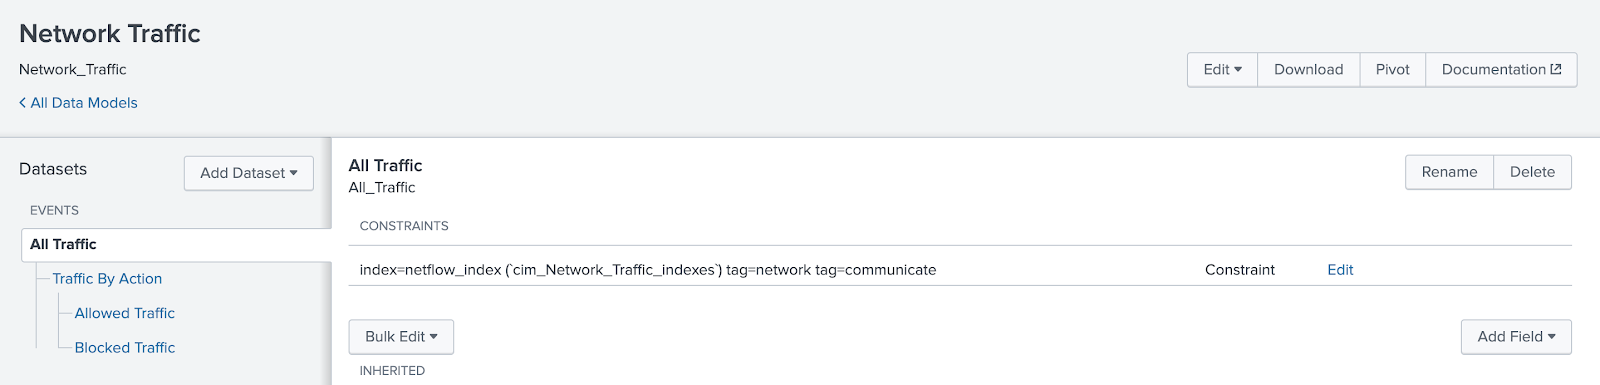
- Before configuring the acceleration of the data model I will add an index constraint to the data model. That is not necessary for a demo/dev environment but in a production environment I should set an index constraint to optimize performance of the data model acceleration. The default constraint will be: (`cim_Network_Traffic_indexes`) tag=network tag=communicate . I will click con Edit at the left of the constraint definition and set the constraint to: index=netflow_index (`cim_Network_Traffic_indexes`) tag=network tag=communicate so that the acceleration will only be made on the netflow_index. Then I will click on the Save green button.
- Now let’s review how the CIM can map Netflow traffic fields contained at netflow_index to CIM:For that click on Datasets and filter by Network traffic: click con Network traffic > All Traffic:


This leads you to a table view of the Network Traffic > All Traffic mappings to the fields contained in Netflow logs from the netflow_index index. Note that many of the fields are left in blank as the Network Traffic>All Traffic model is broader than the set of fields provided by the netflow log.
- Now let’s explore at search time how the CIM model is extracting fields. For that click on Datasets and filter by Network traffic: choose con Network traffic > All Traffic and click on Investigate on Search. You will be redirected to Search in Splunk and will be able to look at how a list of fields in grey have appeared after the json log info. Those are the list of fields that are compatible with the CIM model and that will be extracted for fast long tail searches when it will be accelerated. As the field protoid is not in the list of extracted fields but I need it for some of my dashboards I will manually modify the CIM data model and add it in the next step.


- Click on Datasets and filter by Network traffic and I will choose Network Traffic > All Traffic click on Manage and select Edit Data Model. In the next step click on the Add Field button and select Auto-Extracted

- Splunk will help you by proposing a number of fields that could be extracted from the netflow_index and add it to the data model to later be accelerated. Choose the one we were looking for: protoid, set it as number and optional. Click on save.


- Click on Datasets and filter by Network traffic and I will choose Network Traffic > All Traffic and click on Investigate on Search to have a look at how a list of fields in grey have appeared after the json log info. See that protoid field has been included!

- Now let’s finally set up data model acceleration. For that click on Datasets and filter by Network traffic and choose Network Traffic > All Traffic click on Manage and select Edit Data Model
- On the top right of the menu I will click on Edit and select Edit Acceleration. Then, I will enable acceleration by clicking in the white box besides Accelerate and set the Summary Range depending on the range of data I will like to search. I will set it to 3 months . In advanced settings I could define other parameters such as Backfill Range, Max Summarization Search Time, etc. Not to be modified this time. I will click on save.


After performing the previous configuration steps check that the acceleration icon has been turned yellow to the Netflow Traffic Data model signaling that acceleration is turned on.

Step #5 – Explore the dashboards app
Cool! Now you can click on dashboards at the Netflow sample dashboards app and begin playing with the two existing dashboards:

- @demo: Netflow Dashboards: here I will have examples with long tail data using Splunk tstats command that is used to exploit the accelerated data model we configured previously to obtain extremely fast results from long tail searches. Note that tstats is used with summariesonly parameter=false, so that the search generates results from both summarized data and raw data. That will allow us to enjoy seamlessly in the dashboards the real time experience of schema on read against raw data plus the long tail performance of the schema on write against data model accelerated data.
- @demo: Hosts: here I will have examples using real time data based on Splunk stats command that is used to exploit the raw real time data indexed at Splunk.
To explore the spl contained in each dashboard just click on open in search at the button of the panel of interest and you will see the search that created the panel:


@demo: Netflow Dashboards
Find here some snapshots of the panels included in this dashboard:


@demo: Hosts
Find here some snapshots of the panels included in this dashboard:


Lucas
Notes from Raúl:
Thanks a lot @Lucas for putting all these contents in a post, which I believe is going to be handy for your future self when he needs to work on this topic again and, of course, for others who tried my first post on the topic and couldn’t go further on performance optimizations and visualization.
Outstanding job from an outstanding Sales Engineer, thanks again Lucas.
And, as usual, this is the video that will help everybody to accomplish the goal:
Raúl
